Mathematical Models for Cancer Growth
Mathematical models of tumor growth and the efficacy of drugs help clinicians devise treatment regimens.
Skipper’s Laws
The first of Skipper’s laws is that the doubling time of a tumor is constant. A plot of the number of cells in the tumor over time on a semi-log graph forms a straight line. Working with animals, Skipper showed that organism death happens when the tumor size reaches a certain fraction of the mouse weight, which means survival is associated with the number of tumor cells.
Skipper’s second law states that chemotherapeutic agents work by first order kinetics; a fixed fraction of the tumor cells is killed regardless of the tumor size.
Log-Kill Hypothesis
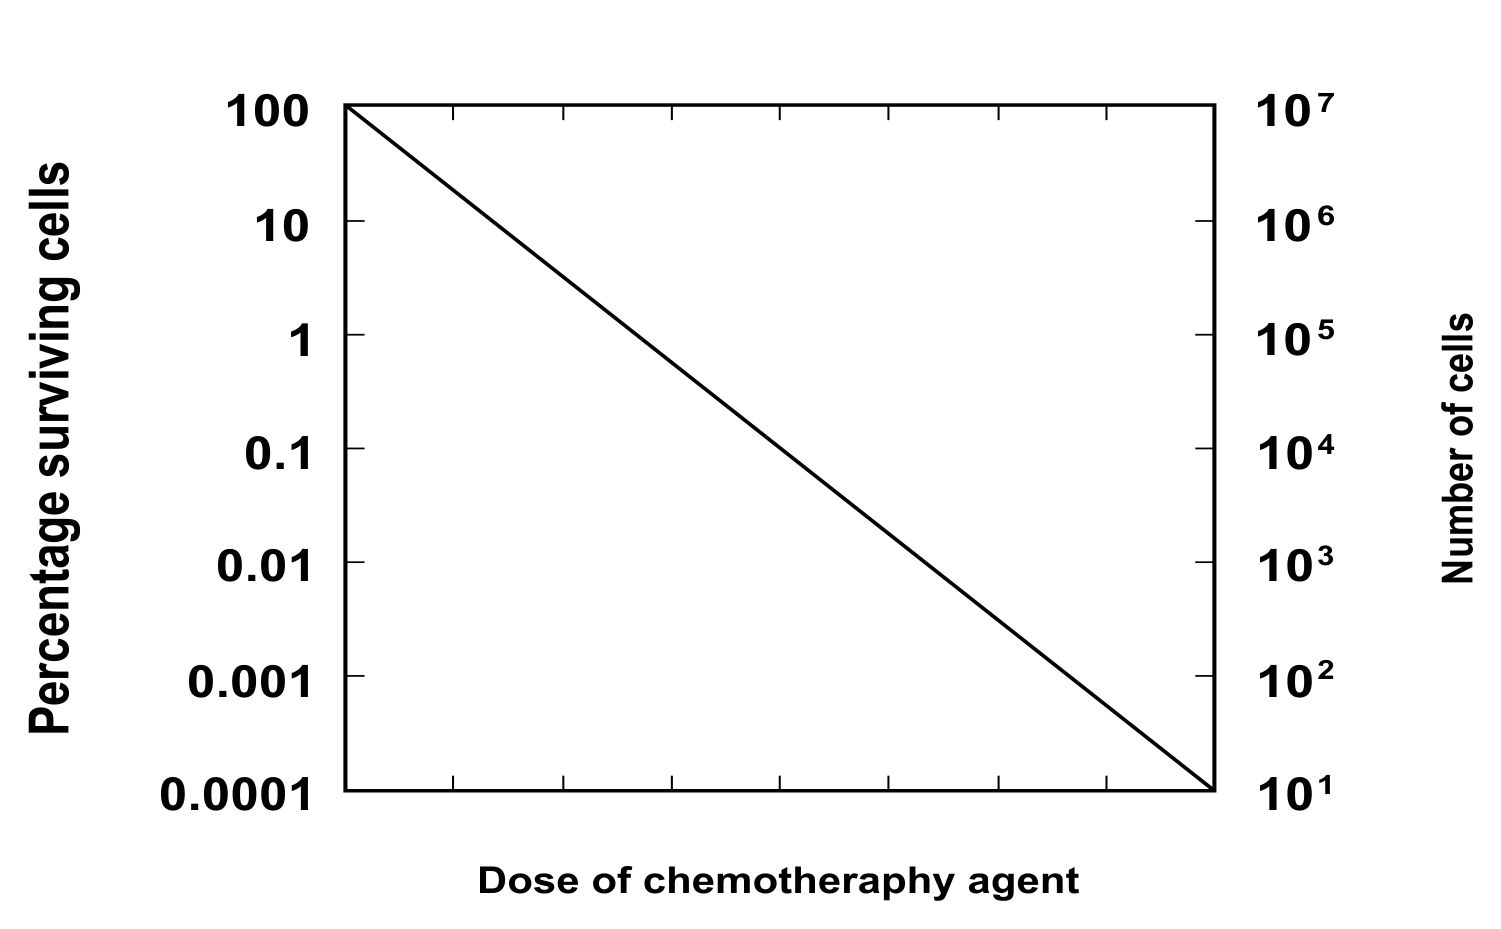
This hypothesis was developed from Skipper’s laws. If tumor doubling time is constant; the time (x) the tumor takes to grow from 1000 cells to 10,000 cells is the same amount of time to grow from 10 million to 100 million cells. The log-kill hypothesis looks at the opposite direction. The fraction of the tumor’s malignant cells that are killed by a chemotherapy application is always the same – no matter how many cells are in the tumor. The log kill number is the base 10 logarithm of the ratio of cell number reduction. Thus 2 log kill means 99% reduction, 6 log kill means 99.9999% reduction. (See short explanation of fractional cell kill hypothesis.)
Norton-Simon Hypothesis
This hypothesis states that tumor cells are killed in response to a chemotherapeutic agent at a rate directly proportional to the tumor growth rate at the start of treatment. This is different from the log kill hypothesis.
Skipper-Schabel-Wilcox Model
Postulate that “a given dose of a given drug will kill approximately the same fraction, not the same number, of widely different-sized tumor cell populations —so long as they are similarly exposed and both the growth fraction and the proportion of drug-resistant phenotypes are the same.” This model resulted in development of the log kill hypothesis.
Goldie-Coldman Hypothesis
This hypothesis predicts that within the tumor cells of a solid tumor, some are resistant to any chemotherapy agent. As the tumor get larger the fraction of cells that are resistant increases. This resistance is independent of the chemotherapeutic agent and depends on the number of cell divisions that occur after treatment begins. The larger the tumor or the longer delay in initiating chemotherapy, the more resistant cells. The implication is that a regimen of alternating cycles of two different non–cross-resistant chemotherapy medicines is the best strategy for shrinking the tumor and causing remission.
Exponential Growth Model
One model that has been used to describe tumor growth is the exponential growth model1.
Equation 1
The exponential does not describe the growth rate in vivo which slows as the tumor size increases.
Gompertz Model
Another model use to describe tumor dynamics is a Gompertz curve or Gompertz function. It is a type of mathematical model for a time series, where growth is slowest at the end of a time period1.
Equation 2
where N∞ is the plateau cell number which is reached at large values of r and the parameter b is related to the initial tumor growth rate. This is the same equation recast (taken from Wikipedia.)
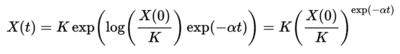
where K is the carrying capacity, i.e. the maximum size that can be reached with the available nutrients, and α is a constant related to how fast the cancer cells multiply.
Even with Gompertzian growth, a single set of growth parameters is insufficient to model the clinical data. Tumor cells almost certainly have different growth characteristics in different patients, and individual micrometastases within a single patient may also have different growth parameters.
Model based on metabolic considerations
To properly understand or derive a mathematical model for cancer growth, we must first understand the process of the ontogenetic development of an organism. This process is fueled by metabolism and follows a certain pattern which occurs primarily through cell division. In a recent paper, a mathematical model based on energy conservation was derived to model such growth and showed that regardless of the different masses and development times, all taxons share a common growth pattern2. It may be possible that cancer growth may be modeled in very much the same way. As the total energy that goes into an organism’s development either goes into the maintenance of existing tissue or the creation of new tissue, we can express this as
Equation 3
where, B is the energy that an organism uses while at rest. The variables, Bc and Nc are the metabolic rate for an individual cell and the number of cells in a particular organism respectively; the NcBc term represents the energy to maintain existing tissue. Ecis the energy needed to create new tissue from an individual cell.
We assume that variables Ec, Bc and mc all remain constant during an organism’s growth and is pertinent to a particular type of organism. Thus the total mass of an organism, m, can be determined from the mass of an individual cell and the number of cells, m = mcNc. By differentiating and substituting this into eq (3), we get
Equation 4
Given that ![]()
where B0 depends on a particular taxon,
Equation 5
As the B0, mc and Ec terms are constant, we can express the above equation succinctly as
Equation 6
where a ≡ B0mc/Ec and b ≡ Bc/Ec.
The 3/4 exponent is roughly the same for all organisms, whether they be mammals, birds, fish or plants. Thus the exponent describes the overall allometry of B from birth to maturity. As there is a tendency for natural selection to optimize energy transport, this has lead to the evolution of a fractal-like distribution network. This exponent is related to the scaling in the total number, Nt of capillaries3,4. As we already know, the total number of cells is related to the organism’s mass. This exponent has the profound implication in that it sets limits on the growth of an organism. Thus the point in which an organism stops growing, i.e. dm/dt = 0, we see that
Equation 7
where M is the symptotic maximum body size. Thus the variation on M among different species within a taxon is determined entirely by the cellular metabolic rate, Bc, which scales to M-1/4. As cancer growth follows the same principles, and as blood and nutrients enter into and feed a tumor, we expect the same scaling principles to apply and thus by using this Universal Law for ontogenetic growth we hope to derive a similar universal law for cancer growth. As B0, mc and Ec are approximately constant, a is independent of M and b = a/M1/4. We can thus rewrite eq (7) as
Equation 8
Solving this differential equation gives
Equation 9
where m0 is the mass of the organism at birth (t = 0). As a and b can be determined from fundamental parameters of a cell, a universal equation has been derived. We can see from the figures below that all growth curves follow the same path. We can infer that if similar considerations are made for cancerous cells, a similar growth curve will be obtained.


Empirical Tests of Mathematical Models for Tumor Growth
Exponential Growth Law
All tumors follow a standard growth pattern, growing fastest in the beginning and eventually reaching a maximum size. There are some weaknesses in the exponential growth model as it fails to model this behavior in vivo.
Gompertz Law
The Gompertz Model, while it does model the behavior as a tumor increases in size, it is not an empirical model. The model has too many variables to consider, such as types of cancers as well as environmental conditions. These may even vary considerably for patients with the same types of cancers1.
Universal Law
The Universal Law model proposed by West, adequately describes the growth rates of organisms by taking energy considerations into account. This model was tested against empirical data5. As powerful as West’s model for growth is, it only applies to organisms growing in unrestricted dietary conditions. Thus only fully replenished tumors will follow this universal growth curve. Differences in growth rates and saturation sizes of up to a factor of 500 were found in tumor spheroids cultured in media with different oxygen levels and glucose concentrations6. Thus deviations from West’s Law depend on particular environmental conditions.
As a tumor reaches a certain size or volume, metastatic dissemination will occur7. As the rate of cell growth is dependent on its development phase, this may serve as a possible explanation why recurrent cancers grow at much slower rates than the primary tumors2. In this case, the residual clonogenic cells of the primary tumor generate cells from an older development phase and thus multiply at a slower rate.
In general, the West model for ontogenetic growth of living organisms applies to the case of solid malignant tumors. The results fit a variety of in vitro and in vivo data5.
Other Points of Interest
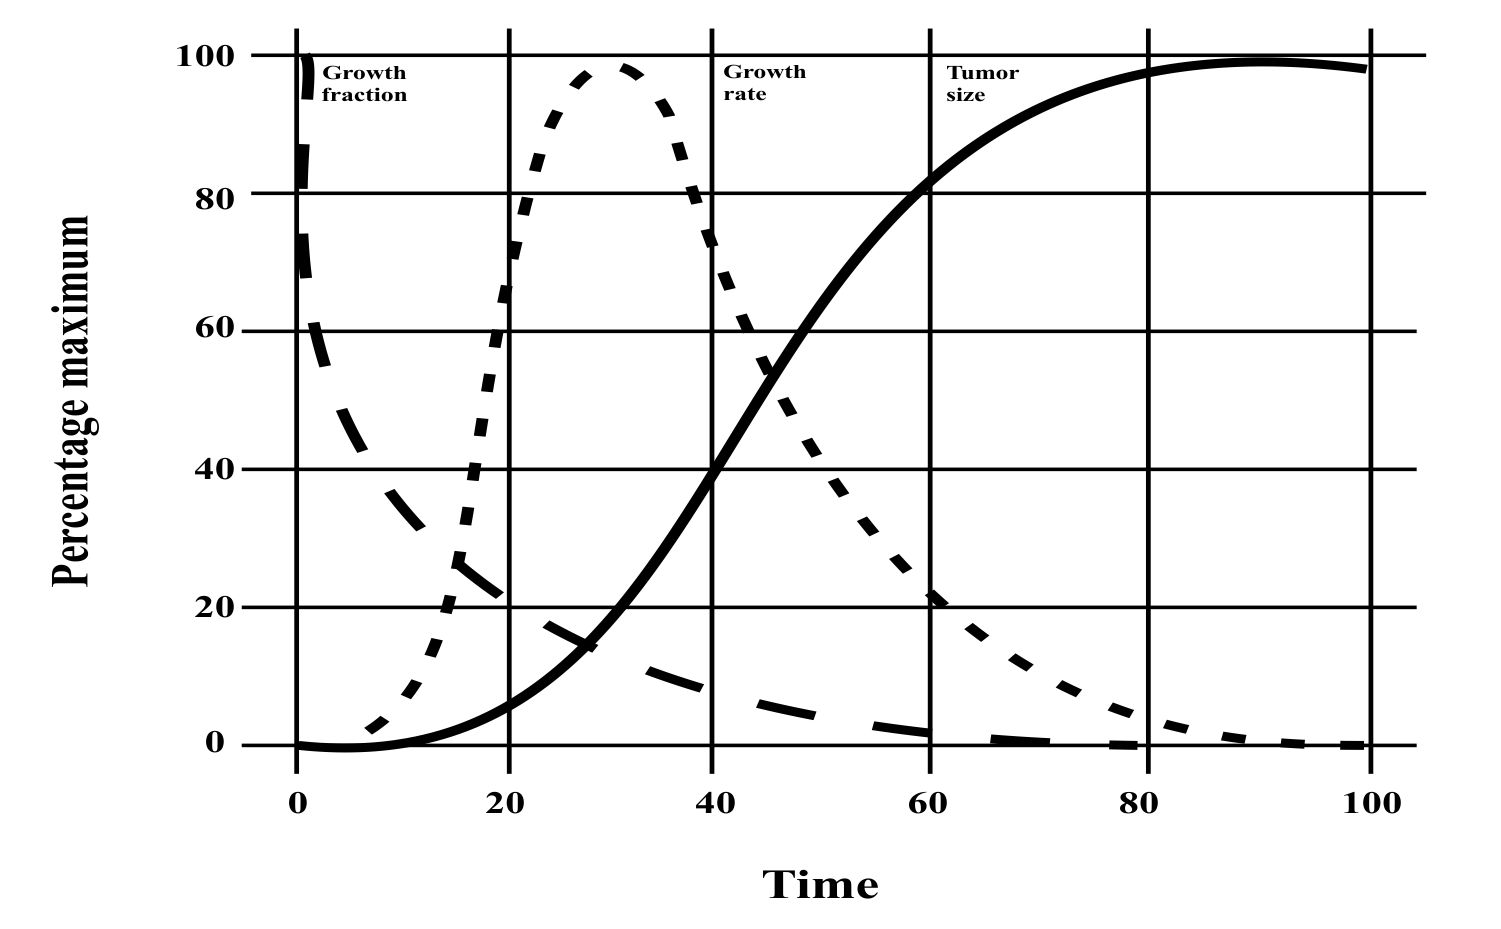
While there isn’t one mathematical model that can adequately describe cancer progression, each model highlights some aspects of growth kinetics. The Gompertz model, for example, shows that a tumor’s rate of growth is greatest at the beginning stages; at this there are no means to detect tumors clinically. The model also predicts that as the tumor grows, its growth rate slows.
The West law on the other hand is a fundamental law as it is based on a physical law: the conservation of energy. This law can explain observed behaviors, for one, that there is a maximum size that a tumor will attain. This maximum size is due the fractal pattern of the blood vessels that deliver oxygen and nutrients; as a vein bifurcates there comes a point that the vein is too small to adequately supply nutrients to the cancerous cells. As the West Model also says that the growth rate changes with developmental stage, it explains why the growth rates of tumors that have metastasized are not as high as the tumorous cells from which they originated.
The National Library of Medicine of Medicine has an extensive page about cytokinetics which may be of interest to people who want to learn more:
http://www.ncbi.nlm.nih.gov/books/NBK20771/
The development of tumor models is important as they offer a way to better understand the growth kinetics of malignant tumors which may lead to the development of successful treatment strategies.13,14 15
Mathematical model for shrinking tumors
One idea – which may not be a good model in all cases – is cell kill theory, which says that a certain percentage of cancerous cells is destroyed in each administration of chemotherapy – and that this percentage is independent of the number of cancerous cells before treatment. The percentage does vary based on size of dose, body weight of patient, physiology of patient, etc. But if all those are fixed, the fraction of malignant cells destroyed does not change with size of tumor. This is why two rounds of chemotherapy treatment do not eliminate all the cancer. Even if the first round eliminates 80 percent, the second round will eliminate 80 percent of what remains, leaving 4 percent of the original cells alive.
References
1 Yorke, E. D., Fuks, Z., Norton, L., Whitmore, W. & Ling, C. C. Modeling the Development of Metastases from Primary and Locally Recurrent Tumors: Comparison with a Clinical Data Base for Prostatic Cancer. Cancer Research 53, 2987-2993 (1993).
2 West, G. B., Brown, J. H. & Enquist, B. J. A general model for ontogenetic growth. Nature 413, 628-631
3 West, G. B., Woodruff, W. H. & Brown, J. H. Allometric scaling of metabolic rate from molecules and mitochondria to cells and mammals. Proc. Natl. Acad. Sci. U. S. A. 99, 2473-2478, (2002).
4 Delsanto, P. P. et al. Growth model for multicellular tumor spheroids. Appl. Phys. Lett. 85, 4225-4227, doi:10.1063/1.1812842 (2004).
5 Guiot, C., Degiorgis, P. G., Delsanto, P. P., Gabriele, P. & Deisboeck, T. S. Does tumor growth follow a ‘universal law’? (2003).
6 Freyer, J. P. & Sutherland, R. M. Regulation of Growth Saturation and Development of Necrosis in EMT6/Ro Multicellular Spheroids by the Glucose and Oxygen Supply. Cancer Research 46, 3504-3512 (1986).
7 Romsdahl, M. D., Chu, E. W., Hume, R. & Smith, R. R. The time of metastasis and release of circulating tumor cells as determined in an experimental system. Cancer 14, 883-888, doi:10.1002/1097-0142(199007/08)14:4<883::aid-cncr2820140426>3.0.co;2-8 (1961).
8 Mackillop, W. J. The growth kinetics of human tumours. Clinical Physics and Physiological Measurement 11, 121 (1990).
9 Spratt, J. S., Jr. & Spratt, T. L. RATES OF GROWTH OF PULMONARY METASTASES AND HOST SURVIVAL. Annals of surgery 159, 161-171 (1964).
10 Steele, J. D. & Buell, P. Asymptomatic solitary pulmonary nodules. Host survival, tumor size, and growth rate. The Journal of thoracic and cardiovascular surgery 65, 140-151 (1973).
11 Collins, V. P., Loeffler, R. K. & Tivey, H. Observations on growth rates of human tumors. The American journal of roentgenology, radium therapy, and nuclear medicine 76, 988-1000 (1956).
12 Tubiana, M. The growth and progression of human tumors: Implications for management strategy. Radiother. Oncol. 6, 167-184, doi:Doi: 10.1016/s0167-8140(86)80151-7 (1986).
13 Chis, O. & Opris, D. Mathematical analysis of stochastic models for tumor-immune systems. (2009).
14 Chignola, R. et al. Forecasting the growth of multicell tumour spheroids: implications for the dynamic growth of solid tumours. Cell Proliferation 33, 219-229, doi:10.1046/j.1365-2184.2000.00174.x (2000).
15 Norton, L. A Gompertzian Model of Human Breast Cancer Growth. Cancer Research 48, 7067-7071 (1988).
 Today’s arsenal of chemotherapy agents includes many different classes of medicines. Researchers continue to find and test new drugs.